

Before you blame Windows, buy new RAM, or drag your machine to a repair shop — run these free diagnostics. Ten minutes of testing can save you thousands of rupees (or dollars) on parts you never needed.
⚡ Quick Read — The 30-Second Version
- PC feels slow, no idea why? Run UserDiag’s 5-minute Quick diagnosis — it benchmarks everything and flags the weak link.
- Blue screens & random crashes? Boot MemTest86 from USB to rule out faulty RAM, then stress-test with OCCT.
- Audio crackles or stutters? LatencyMon names the exact driver causing it.
- Worried about your SSD/HDD? CrystalDiskInfo reads its health in seconds; CrystalDiskMark measures its real speed.
- Just want big benchmark numbers? Cinebench 2026 for CPU, 3DMark for GPU.
- All 11 tools are free for personal use, and most run portable — no installation needed.
Every PC eventually has one of those weeks. Games that ran fine last month start stuttering. The fans spin up for no obvious reason. Maybe you get a blue screen mid-download, or your laptop suddenly takes three minutes to boot when it used to take thirty seconds.
The tempting fix is to throw money at it — new RAM, a fresh SSD, or the nuclear option of reinstalling Windows. But here’s the thing I’ve learned after years of troubleshooting machines (my own Legion 5 included): most PC problems point to one specific component, and the right free tool will name it in minutes.
This guide covers 11 programs I keep on a USB stick at all times, sorted into four buckets: stability testing, hardware identification, storage health, and pure benchmarking. Grab the ones that match your symptoms, and if you want even more utilities in one place afterwards, check out WSCC, which bundles 300+ Windows tools into a single launcher.

🔥 Stability Testing & Deep Diagnostics
Start here if your PC crashes, freezes, restarts on its own, or misbehaves in ways you can’t reproduce on demand.
1. OCCT — The Full-System Torture Chamber
StabilityFree for home use
OCCT (now at version 17, under the Corsair umbrella) is the tool I reach for after any hardware change. It doesn’t just benchmark — it deliberately pushes your processor, graphics card, memory, and even your power delivery to their limits while watching temperatures, voltages, clock speeds, and wattage in real time. Everything gets charted, so a misbehaving component sticks out like a sore thumb on the graph.
Built a new rig? Swapped a cooler? Nudged your CPU past stock speeds? An hour-long OCCT session with zero errors is the closest thing to a certificate that your machine won’t fall over under pressure. There’s even a dedicated power test that hammers CPU and GPU simultaneously — brutal on weak power supplies, and exactly the point.

2. UserDiag — Automatic “What’s Slow?” Detector
DiagnosticsPortable
UserDiag answers the question every frustrated PC owner asks: “Is my computer performing the way it should?” Pick the recommended 5-minute Quick diagnosis (or the 20-minute Long version for intermittent issues), and it benchmarks your processor, graphics card, memory, and drives using respected engines like Prime95 and FurMark under the hood.
The clever bit is what happens next: your scores get compared against thousands of machines with similar hardware. If your CPU is scoring 30% below identical chips, UserDiag tells you — along with hints about what usually causes it (thermal throttling, background junk, outdated drivers). The report opens right in your browser, plain enough for anyone to read.

I’ve written a full hands-on review of this one — read the complete UserDiag review here.
Download UserDiag →
3. MemTest86 — The RAM Lie Detector
Boots from USBFree edition
Faulty RAM is the great impostor of PC problems. It masquerades as driver crashes, corrupted files, random reboots, and blue screens with a different error code every time. Windows-based memory tests often miss it because Windows itself is sitting in the memory being tested.
MemTest86 sidesteps that entirely: you write it to a USB drive, boot from it before Windows loads, and let it run a battery of deep memory tests with nothing else in the way. It works on both UEFI and legacy BIOS systems, and the free edition covers home use completely. One clean pass is reassuring; four clean passes and you can confidently cross RAM off the suspect list.

4. LatencyMon — For Audio Crackles & Stutters
LatencyFree
Audio popping during playback, micro-freezes while streaming, glitchy recordings — these usually aren’t your speakers or your soundcard. They’re driver problems, where some badly behaved driver hogs the processor for milliseconds too long and your audio buffer runs dry.
LatencyMon watches DPC and ISR execution times (the low-level plumbing where drivers do their work) and points a finger at the exact driver file causing the delays. Within minutes of monitoring, you get a plain-English conclusion about whether your system can handle real-time audio, plus a ranked list of offenders — often a network or storage driver you’d never have suspected. Home users, students and non-commercial folks can use it free.

🔍 Hardware Identification & Monitoring
Know exactly what’s inside your machine — and whether it’s running at the speeds you paid for.
5. CPU-Z — Your Processor’s ID Card
CPU & RAMPortable version
CPUID’s little utility has been the first download on every fresh Windows install of mine for over a decade. It lays out your processor’s model, architecture, live clock speed, and voltage; your motherboard’s chipset and BIOS version; and — crucially — your RAM’s actual running speed and timings via the SPD tab.
That last part matters more than people realise. Plenty of PCs ship with fast memory running at slow default speeds because XMP/EXPO was never switched on in the BIOS. CPU-Z exposes that in ten seconds. It also packs a quick single-core/multi-core benchmark and a basic stress test, so you can sanity-check performance without installing anything else.

6. GPU-Z — Everything About Your Graphics Card
GPUPortable
TechPowerUp’s companion tool does for graphics cards what CPU-Z does for processors. One window shows your GPU model, video memory type and size, BIOS version, driver version, and whether features like Resizable BAR are actually active.
The Sensors tab is where it earns its keep: live readouts of temperature, load, clock speeds, fan RPM, and power draw. Buying a used graphics card? GPU-Z helps verify the card is genuine and that the PCI Express link is running at full width and speed — a favourite trick for catching cards that were misrepresented by the seller.

7. HWiNFO — The Sensor Encyclopedia
EverythingPortable + Store app
When CPU-Z and GPU-Z aren’t detailed enough, HWiNFO is the deep end of the pool. It reads practically every sensor your hardware exposes — per-core temperatures, individual voltage rails, memory timings, drive temperatures, fan speeds, battery wear on laptops — and can log all of it over time.
That logging ability makes it a genuine troubleshooting weapon: run HWiNFO in the background during a gaming session, and afterwards you can see precisely when the CPU hit its thermal ceiling or a voltage dipped. It’s dense, yes, but the Summary view keeps things approachable, and it’s free for personal use with a handy Microsoft Store version too.

8. Speccy — The Friendly Overview
System infoFree
Not everyone wants HWiNFO’s wall of numbers. Speccy, from the CCleaner folks at Piriform, presents your full system spec — OS, CPU with live temperature, RAM configuration, motherboard, graphics, storage — in a clean, scannable layout that you could show your least technical relative.
It’s the tool I recommend when someone asks “what PC do I have?” before buying an upgrade, or when a support forum asks for your specs. A paid Professional tier adds automatic updates and support, but the free version does everything most people need.

💾 Storage Health & Speed
Drives fail quietly until they fail loudly. These two catch the warning signs early.
9. CrystalDiskInfo — Your Drive’s Health Report
Drive healthPortable
Every modern SSD and hard drive keeps a private diary called SMART data — reallocated sectors, power-on hours, temperature history, error counts. CrystalDiskInfo translates that diary into a simple verdict: a big blue Good, a yellow Caution, or a red Bad.
The moment a drive slips to Caution — usually from pending or reallocated sectors — that’s your signal to back up immediately and plan a replacement. The tool can even sit in the tray and alert you when temperatures spike or health changes. It has genuinely saved my data once, giving me a two-week head start before an ageing drive gave up.

10. CrystalDiskMark — Is Your SSD as Fast as Advertised?
Drive speedPortable
The sibling tool measures what your storage actually delivers. It runs sequential tests (big-file speed — think video copies) and random 4K tests (small scattered reads — what Windows boot and app launches feel like), for both reading and writing.
Compare the numbers against your drive’s spec sheet. An NVMe drive rated for 5,000 MB/s that benchmarks at 800 MB/s might be sitting in the wrong M.2 slot, missing a driver, overheating, or nearly full. And if your everyday PC still feels sluggish even with healthy drives, pair this test with our 12 Windows 11 performance tweaks for 2026 — software drag is often the real culprit.

🏆 Pure Performance Benchmarks
For when you want a score — to compare, to compete, or to measure an upgrade.
11. Cinebench 2026 — The CPU Benchmark Everyone Quotes
CPU + GPUFree
Maxon’s benchmark got a major overhaul this generation. Cinebench 2026 now runs entirely on Redshift — the production rendering engine behind Cinema 4D — making its multi-threaded workload dramatically heavier and far closer to real professional rendering than older versions. There’s even a new test that measures how much simultaneous multithreading (SMT/Hyper-Threading) actually adds on your particular chip.
Run the multi-core and single-core tests, then compare your numbers against the built-in ranking of other processors. One important note: scores from Cinebench 2026 can’t be compared with Cinebench 2024 results — the scoring scale was rebuilt from scratch. Also, the GPU test now requires a card with at least 8 GB of video memory, so older or entry-level GPUs will only see the CPU tests. It’s free on Windows and macOS.

Bonus: 3DMark — The Gamer’s Scoreboard
GPUFree demo on Steam
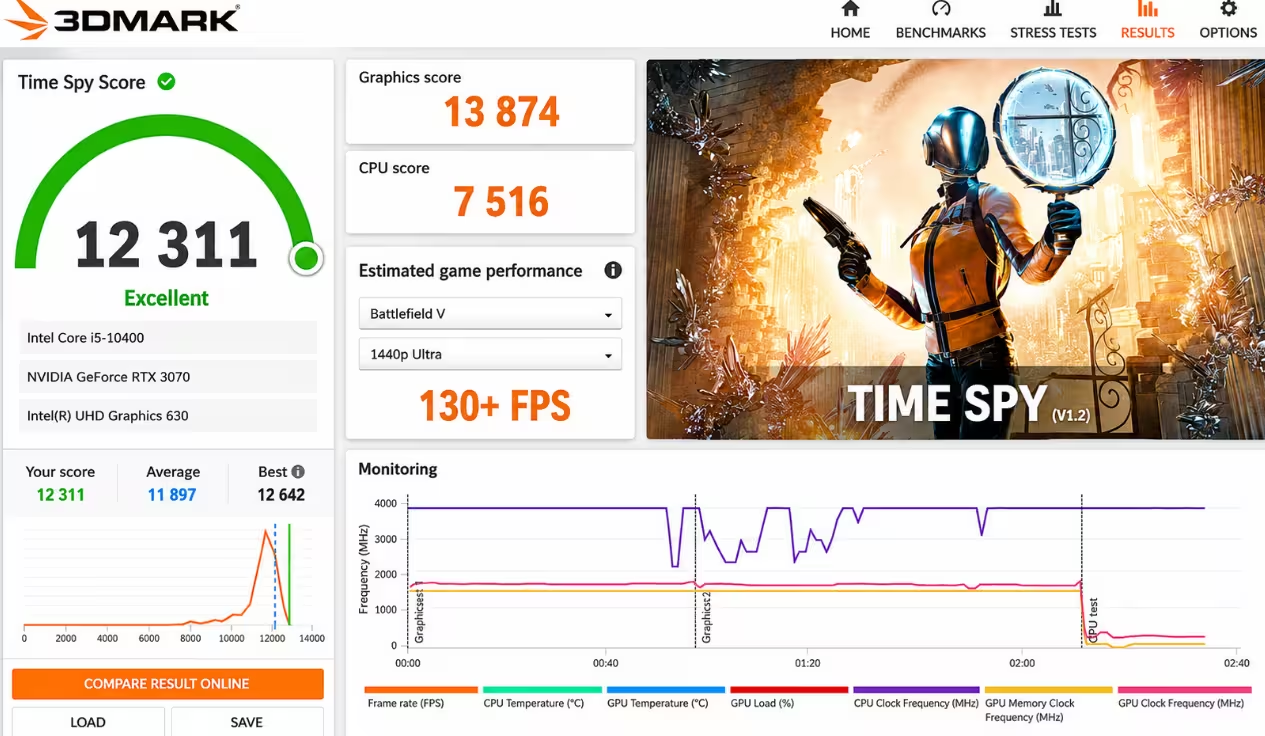
For graphics cards, UL Solutions’ 3DMark remains the yardstick the whole industry measures against. Tests like Time Spy, Steel Nomad, Fire Strike, and Night Raid cover everything from integrated graphics to flagship gaming rigs, and every run produces a score you can stack against millions of other systems online.
The free demo on Steam includes the most popular benchmarks — plenty for checking whether your GPU performs where it should. The paid Advanced Edition unlocks the full test suite, stress tests, and custom settings, and it goes on deep discount during nearly every Steam sale.
📋 Which Tool for Which Problem? (Cheat Sheet)
| Your Symptom | Run This First | Then Confirm With |
|---|---|---|
| PC slower than it should be | UserDiag | CrystalDiskMark, HWiNFO logging |
| Blue screens / random restarts | MemTest86 | OCCT CPU + RAM test |
| Crashes only under load / while gaming | OCCT | HWiNFO temperature logs |
| Audio crackling, stutters | LatencyMon | Driver updates for flagged files |
| Suspect a dying drive | CrystalDiskInfo | Back up first, then CrystalDiskMark |
| “What hardware do I have?” | Speccy | CPU-Z / GPU-Z for specifics |
| Checking an upgrade or overclock paid off | Cinebench 2026 | 3DMark for the GPU side |
| Verifying a second-hand GPU | GPU-Z | 3DMark stress run |
One more habit worth building: run a baseline benchmark on your PC while it’s healthy. Save the Cinebench, CrystalDiskMark, and UserDiag numbers somewhere. Six months later, when something feels off, you’ll have your own reference point instead of guessing. And if your diagnosis turns up Windows-level trouble rather than hardware, Sioni Windows Toolkit Pro puts every repair command one click away.
🏁 Final Verdict
★★★★★
You don’t need a repair shop to find out what’s wrong with your PC — you need ten minutes and a USB stick. These 11 free tools cover the complete diagnostic journey: UserDiag and OCCT find instability, MemTest86 and LatencyMon isolate the sneaky culprits, CPU-Z, GPU-Z, HWiNFO and Speccy tell you exactly what you own, the CrystalDisk duo guards your data, and Cinebench 2026 plus 3DMark put a number on your performance.
My personal starter pack: keep CrystalDiskInfo, CPU-Z, HWiNFO and a MemTest86 USB on hand permanently. Those four alone will diagnose 90% of the problems a typical PC develops in its lifetime — and every single one costs nothing.
❓ Frequently Asked Questions
Which free tool should I run first if my PC is acting up?
Start with UserDiag. Its 5-minute Quick diagnosis benchmarks your CPU, GPU, RAM and storage, then compares results against thousands of similar machines and flags anything underperforming. From there, use a specialist — MemTest86 for RAM, CrystalDiskInfo for drives, OCCT for stability — to confirm the suspect.
Are these PC diagnostic tools really free?
Yes — every tool here is free for personal use. Some offer optional paid tiers (OCCT for commercial use, MemTest86 Pro for advanced reporting, 3DMark Advanced Edition, Speccy Professional), but the free versions cover everything a home user needs.
How do I test my RAM for errors causing blue screens?
Use MemTest86. Write it to a USB drive, restart, and boot from the USB so it tests memory outside Windows. Let it complete at least one full pass — four if you want certainty. Any red errors mean a faulty module; test sticks one at a time to find which.
What is a safe temperature for my CPU and hard drive?
Most CPUs are fine under 85°C at heavy load; sustained 95°C+ points to a cooling problem worth fixing. Hard drives prefer staying below 45°C — CrystalDiskInfo shows the temperature at a glance and can warn you when it climbs.
Can Cinebench 2026 scores be compared with Cinebench 2024?
No. Maxon rebuilt Cinebench 2026 around its latest Redshift engine and recalibrated scoring, so the two versions use different scales. Only compare 2026 scores with other 2026 scores.
How long should I run OCCT to confirm my PC is stable?
One hour of the CPU + RAM test is a solid baseline for everyday machines. After overclocking or a new build, extend to 2–3 hours and add the power test to load CPU and GPU together. Zero errors and sane temperatures = stable system.
Which of these tools saved your PC (or your wallet)? Drop your story in the comments — and if you found a weak component using one of them, tell us what it turned out to be. 👇


Discover more from Techno360
Subscribe to get the latest posts sent to your email.
You must be logged in to post a comment.